
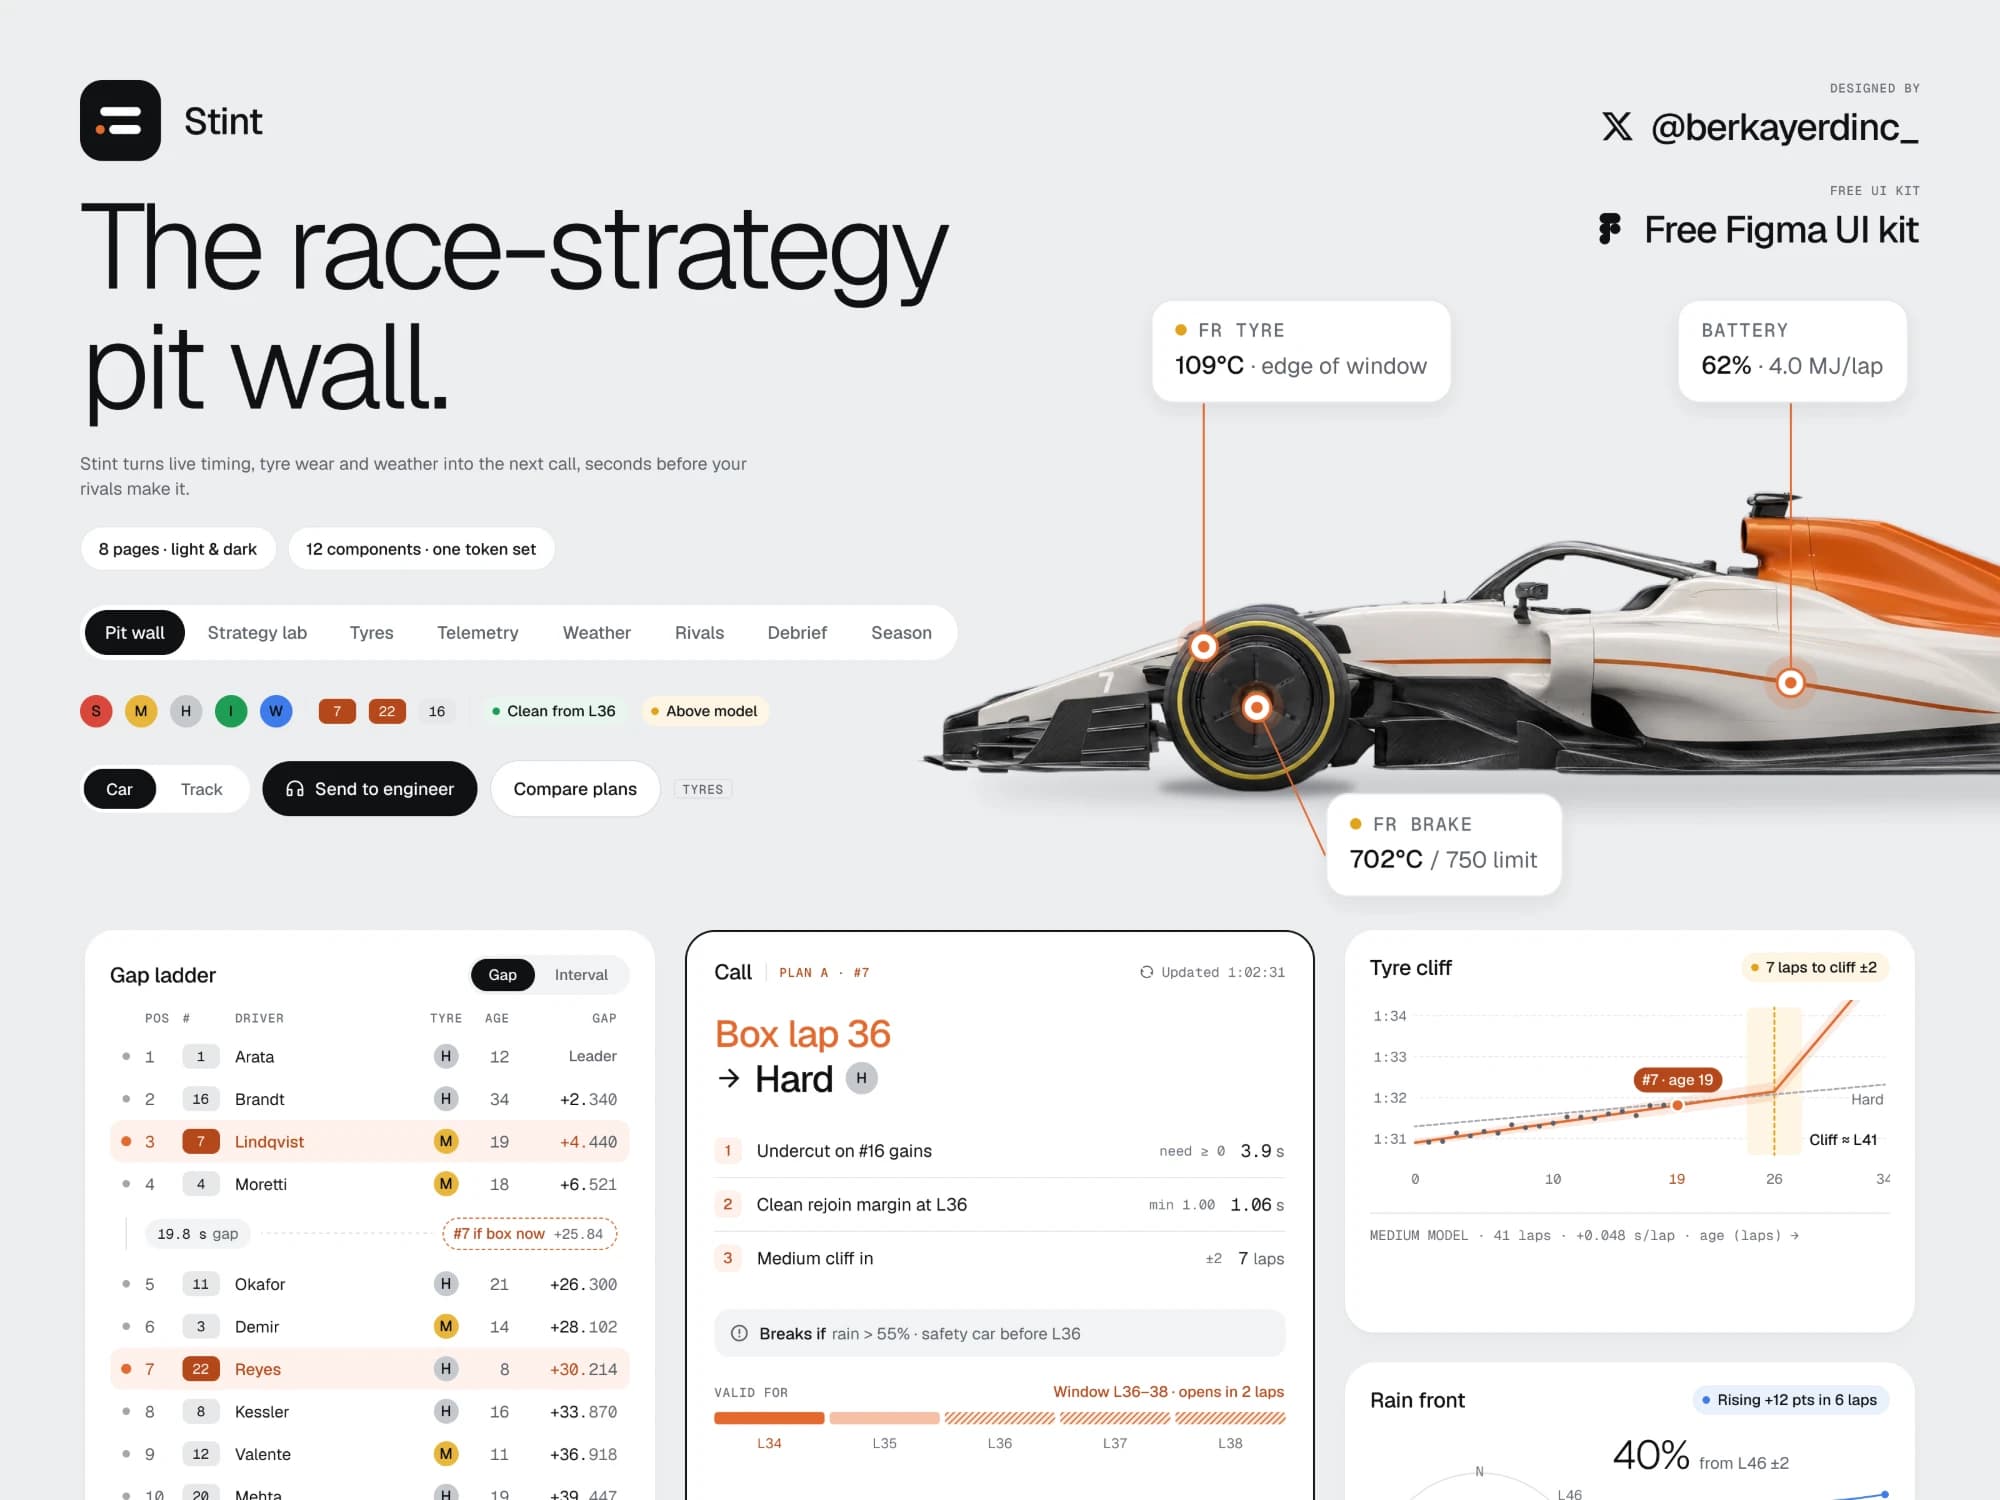
A calm wall for a chaotic race.
Stint is a race-strategy pit wall: live timing, tyre wear and weather turned into the next call. A full product, 8 pages, both modes, one dataset. Free, because I can.
- 8 pages × 2 modes
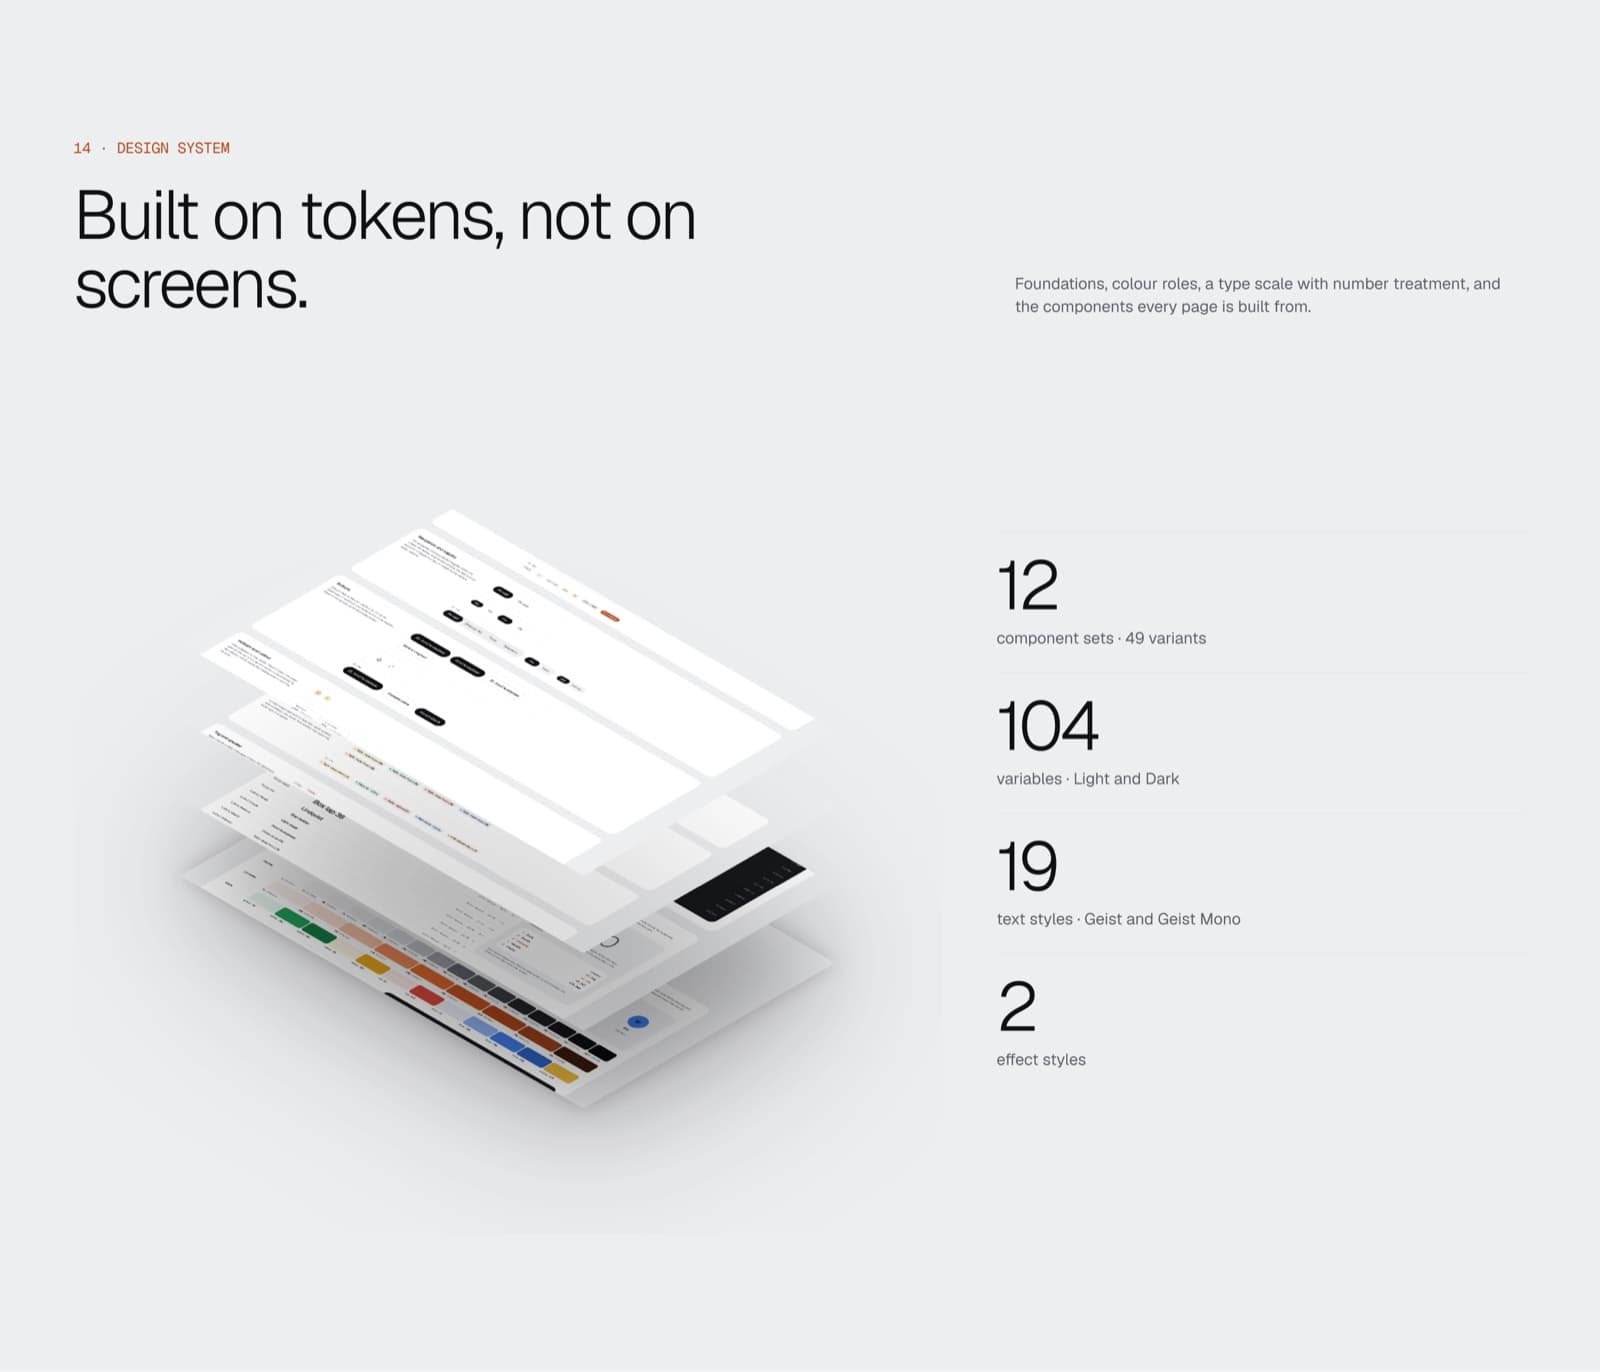
- 104 variables
- 12 component sets / 49 variants
- 19 text styles
- 1 dataset
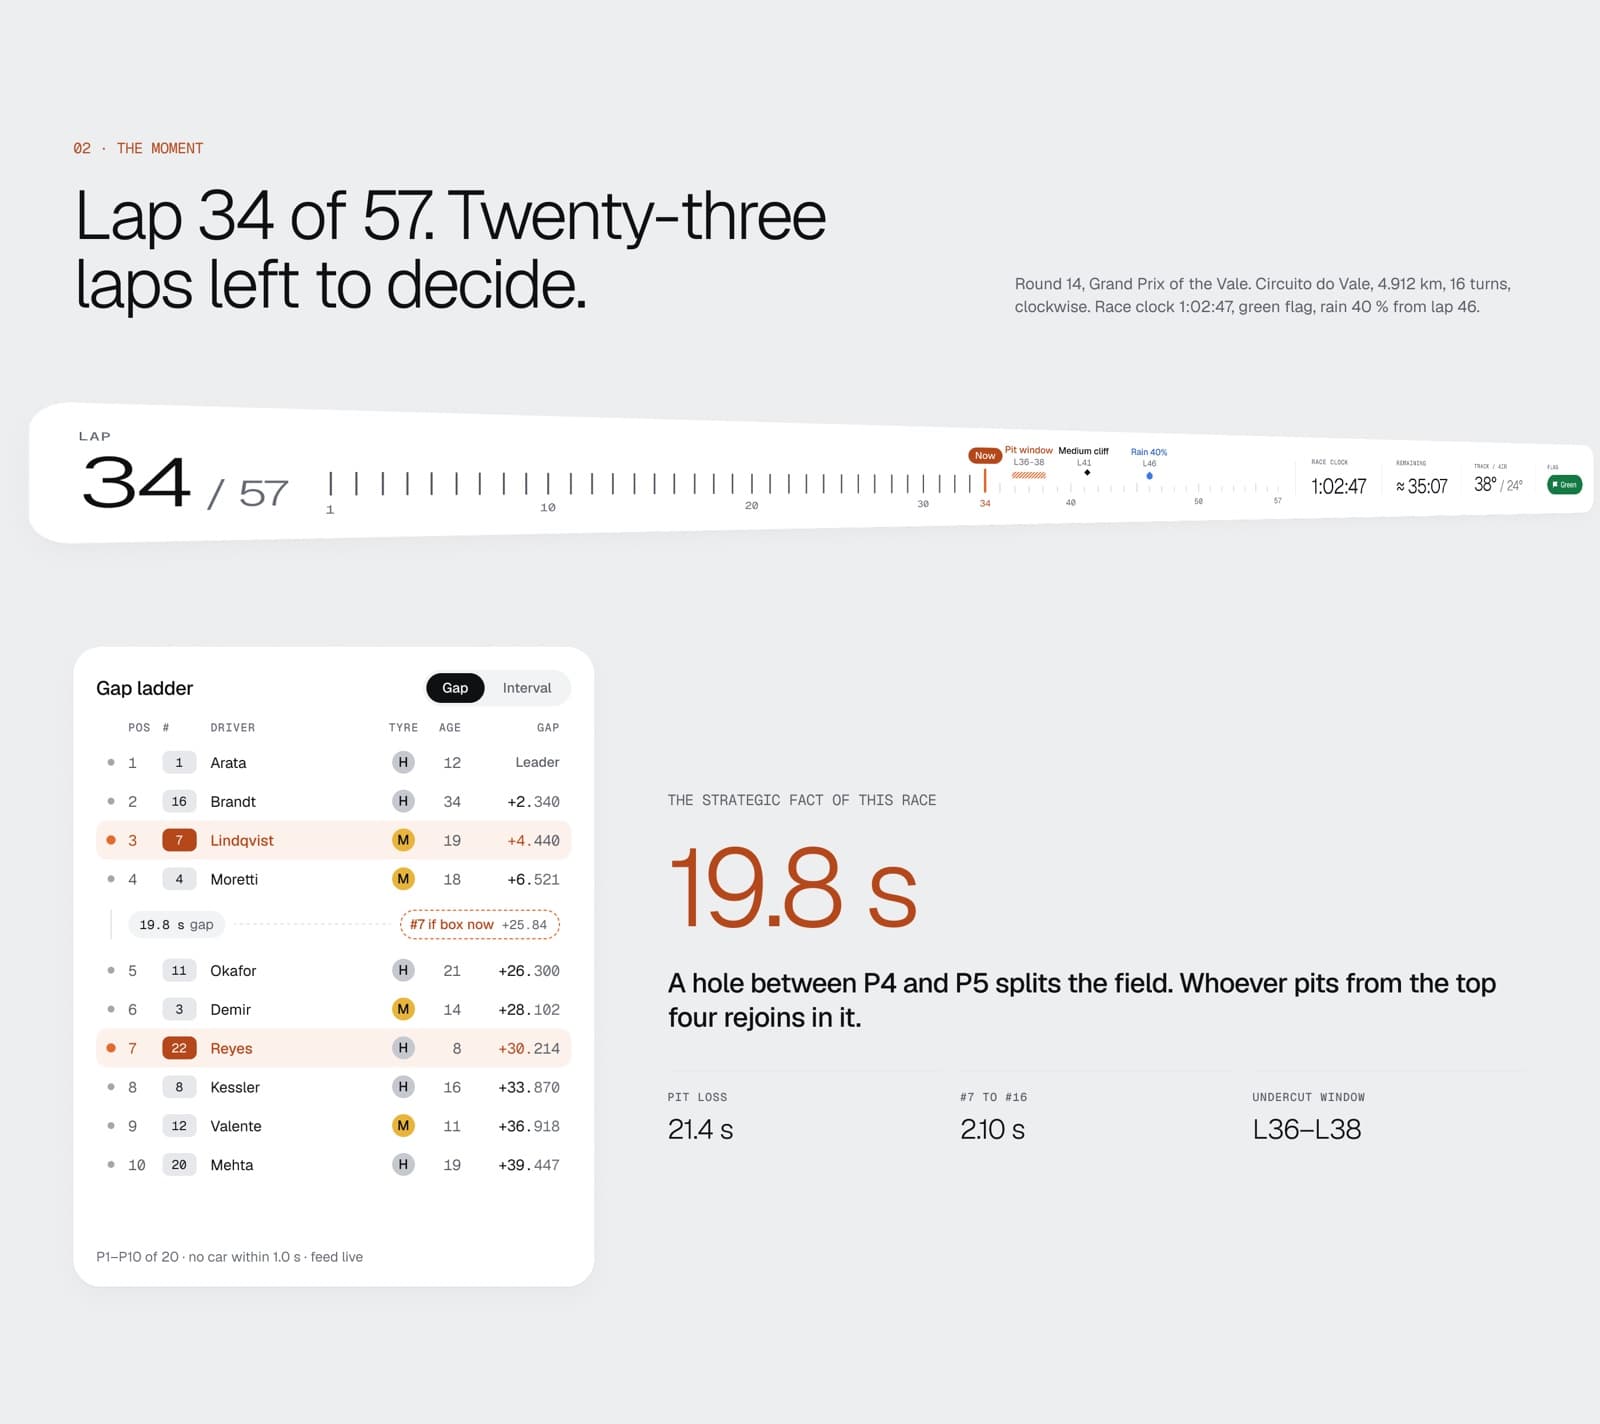
Lap 34 of 57. Two laps to decide.
The leader is 4.4 s up the road. Your tyres are 19 laps old. Rain is 18 km out, moving at 58 km/h. Somebody on the pit wall has two laps to make the call worth more points than anything the driver does all afternoon.
Stint is the screen they look at.
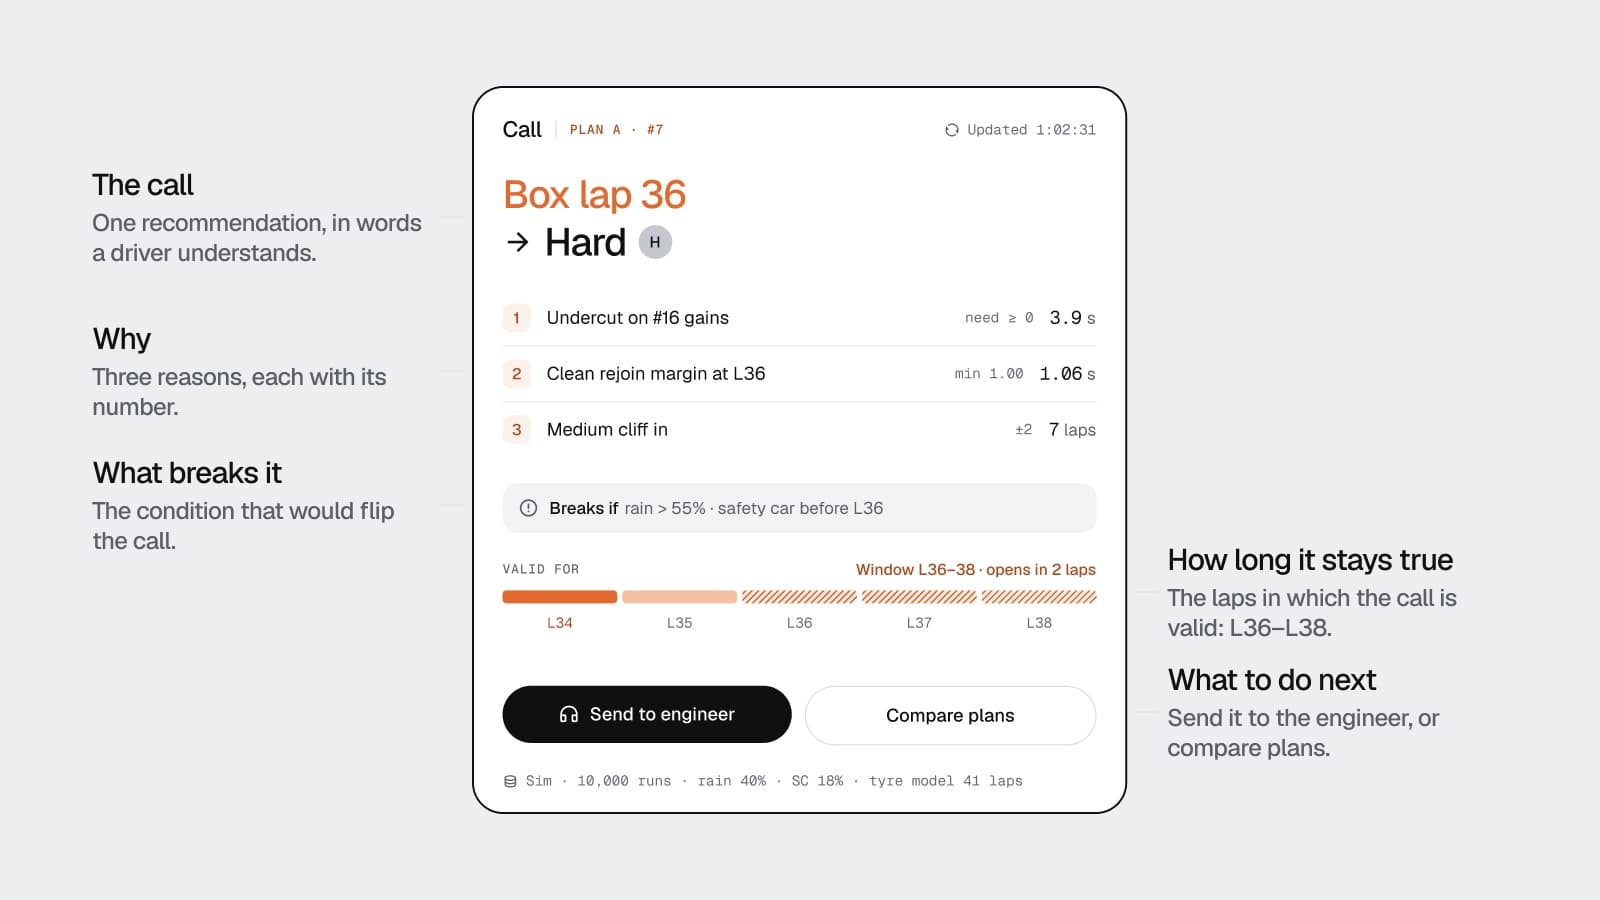
It doesn't show data. It shows the call.
Box lap 36 → Hard. Three reasons, what would break it, and the laps it stays valid (L36–L38). Every other block on the screen is evidence for or against that one card.
Eight pages. One race. Zero filler.
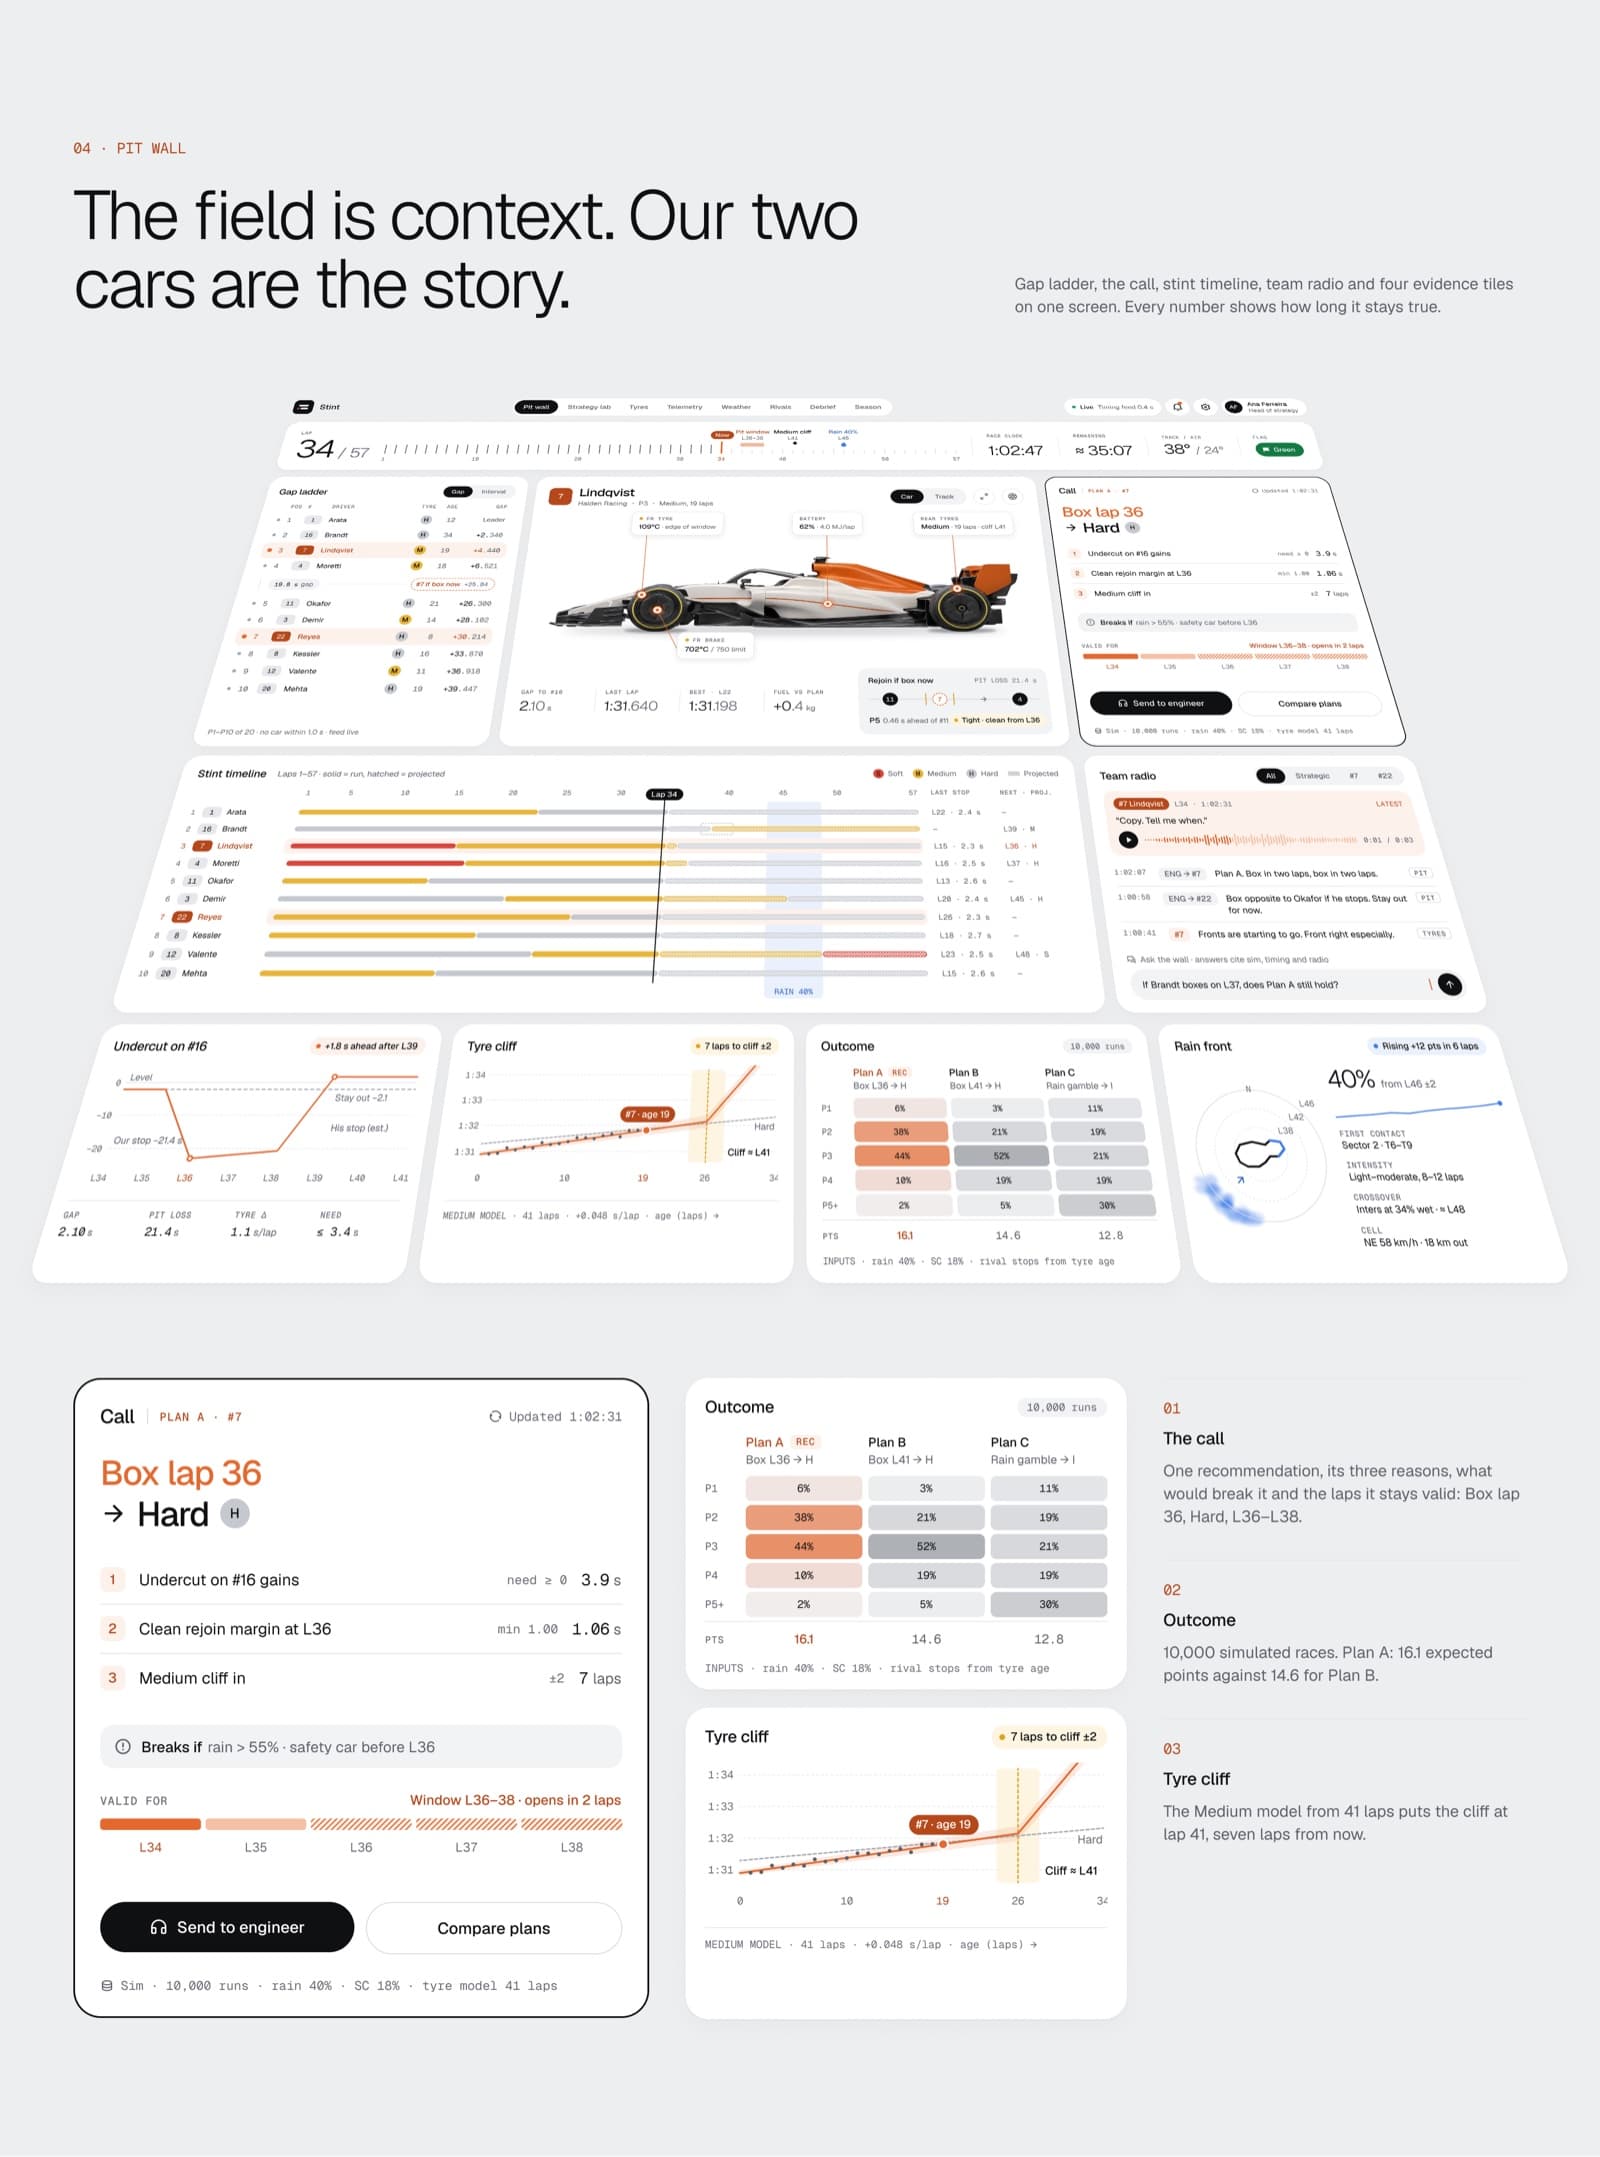 01Pit WallThe call, the car and the live field on a clay circuit.
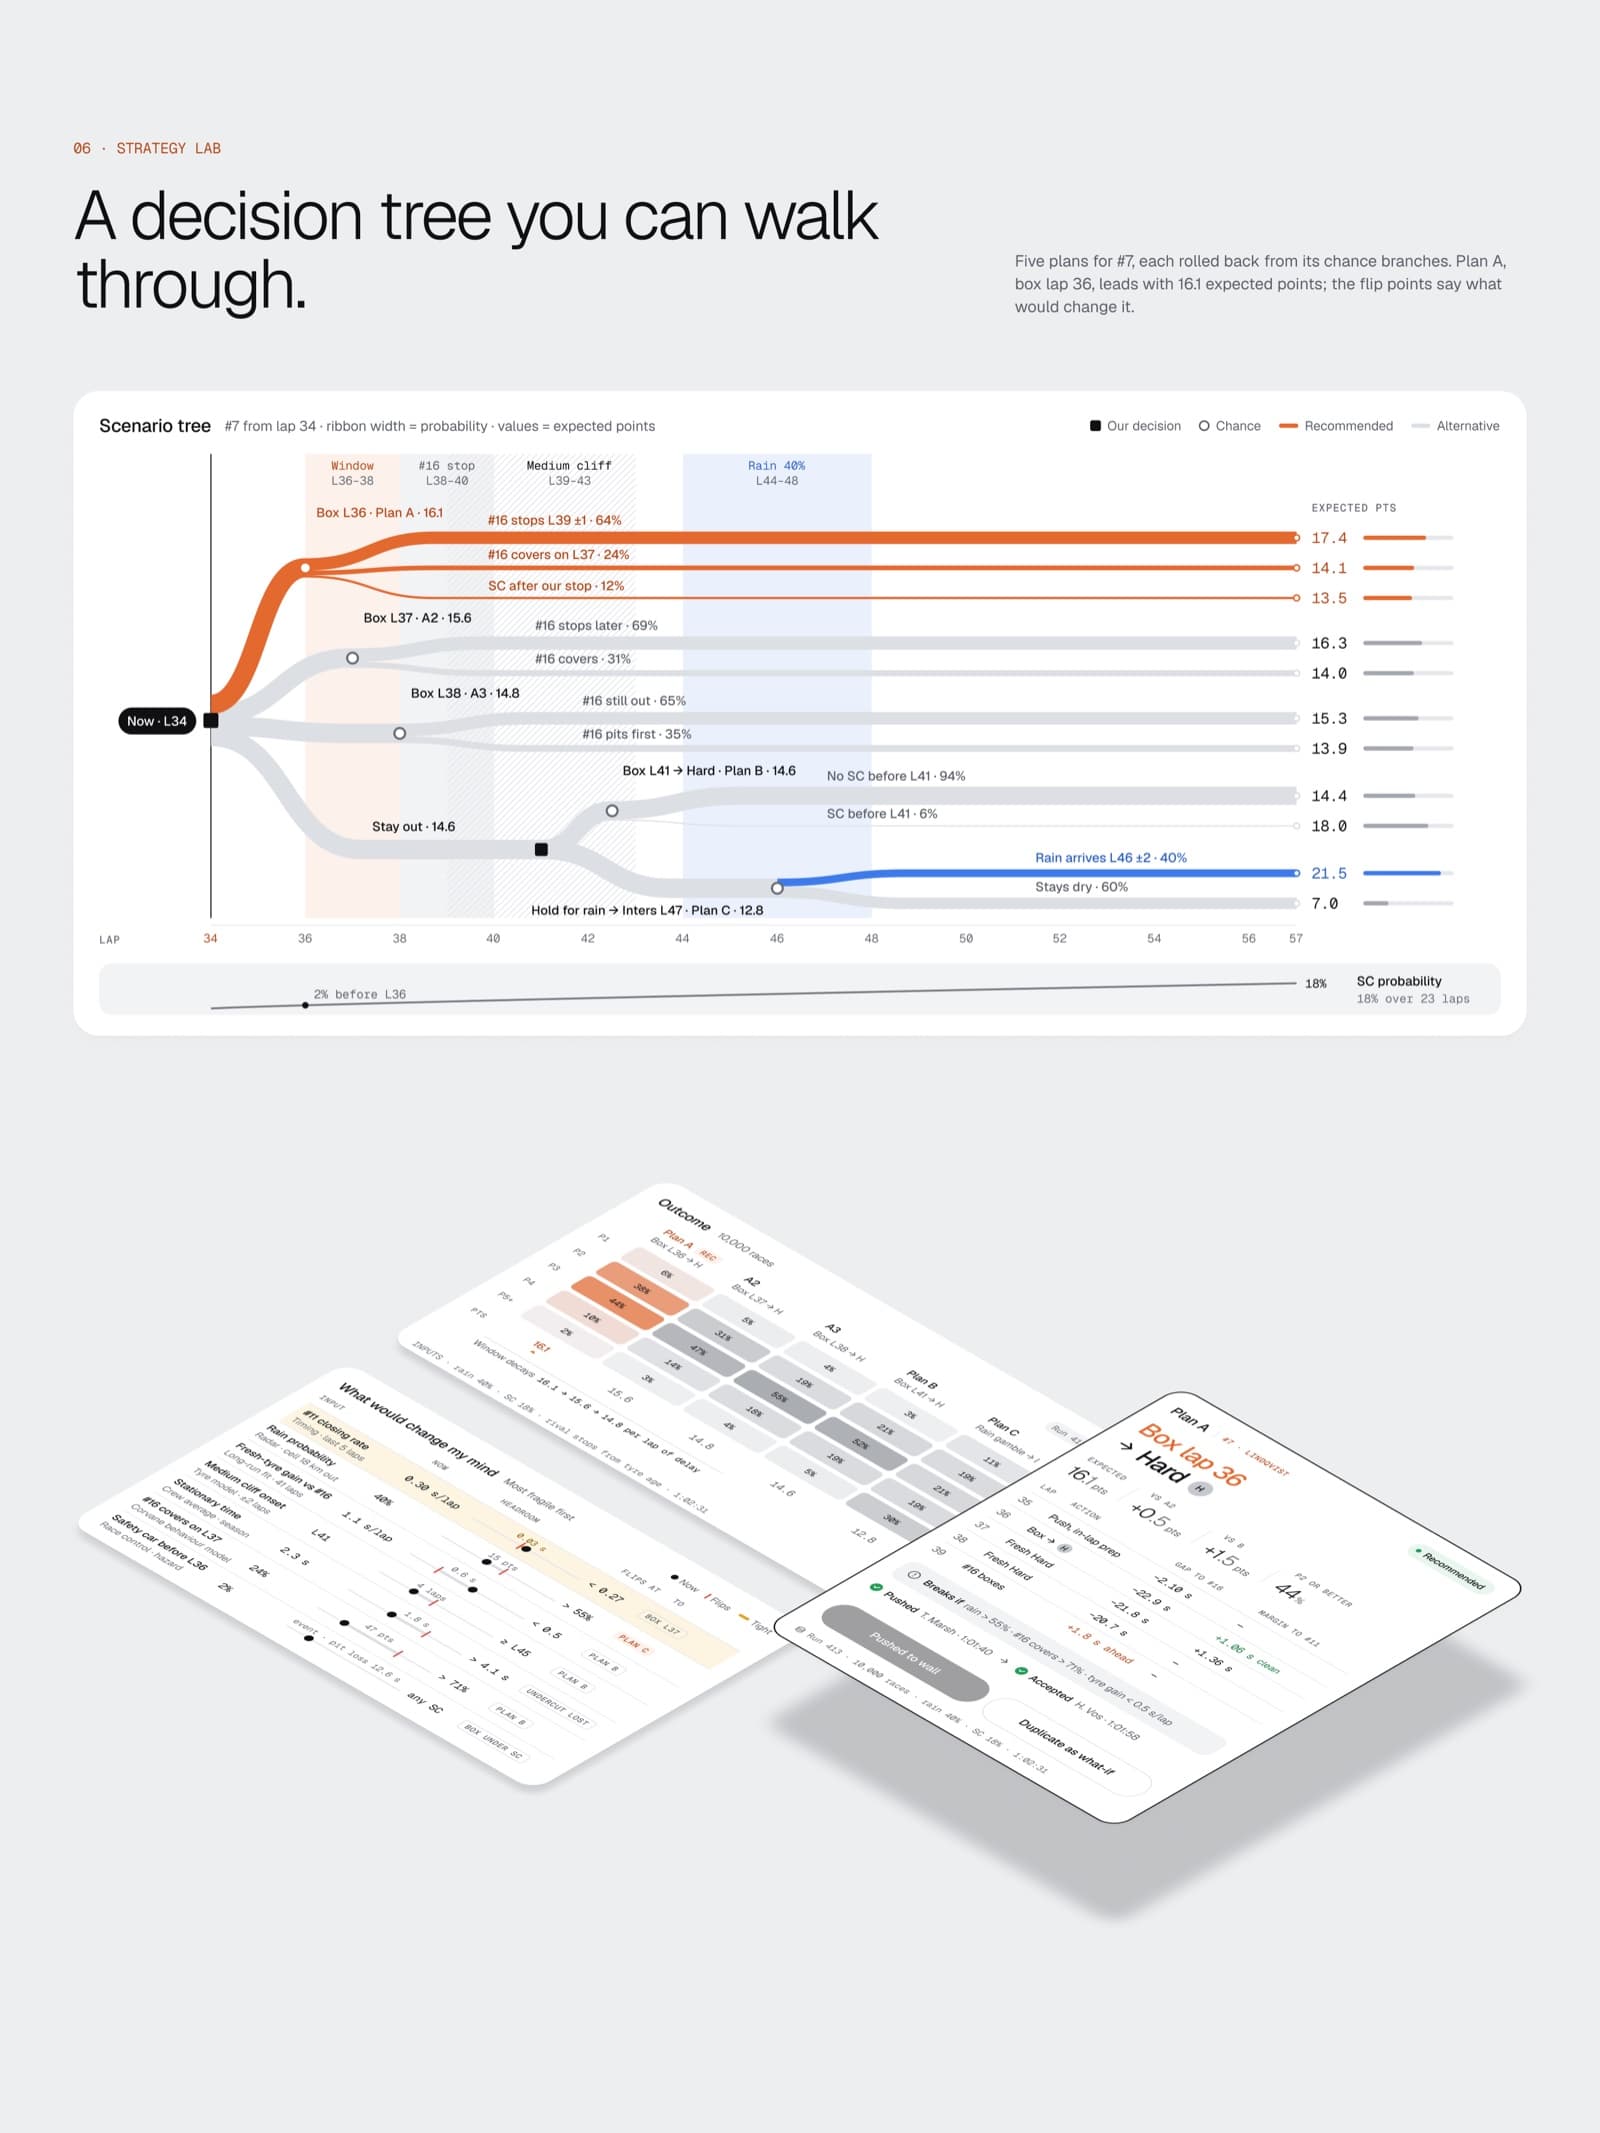 02Strategy LabScenario tree, outcome fans and the inputs that would flip the plan.
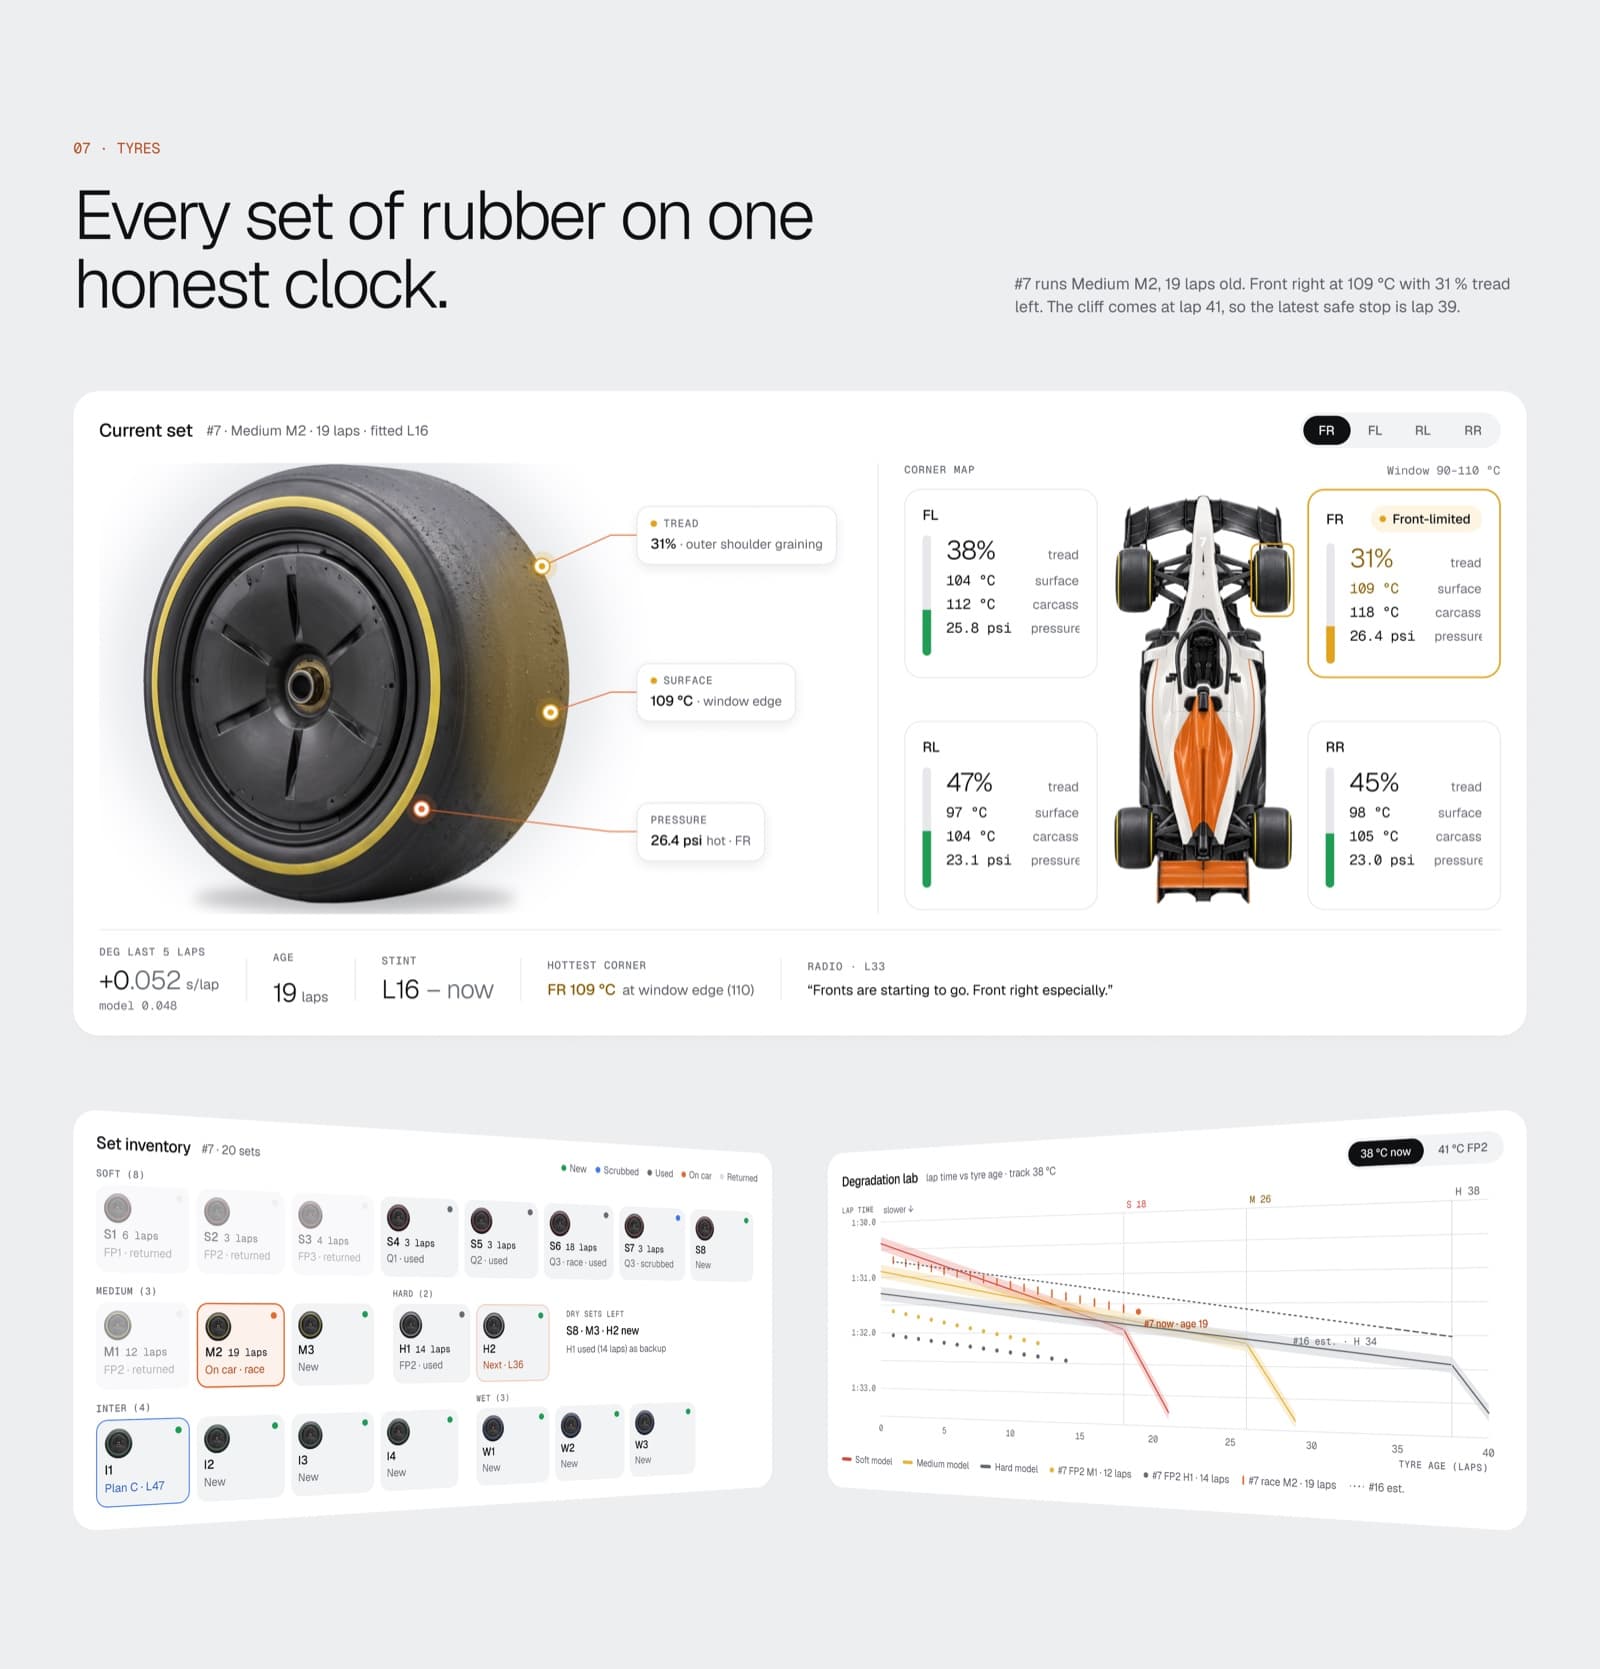 03TyresCliff clock: our Medium falls off on lap 41.
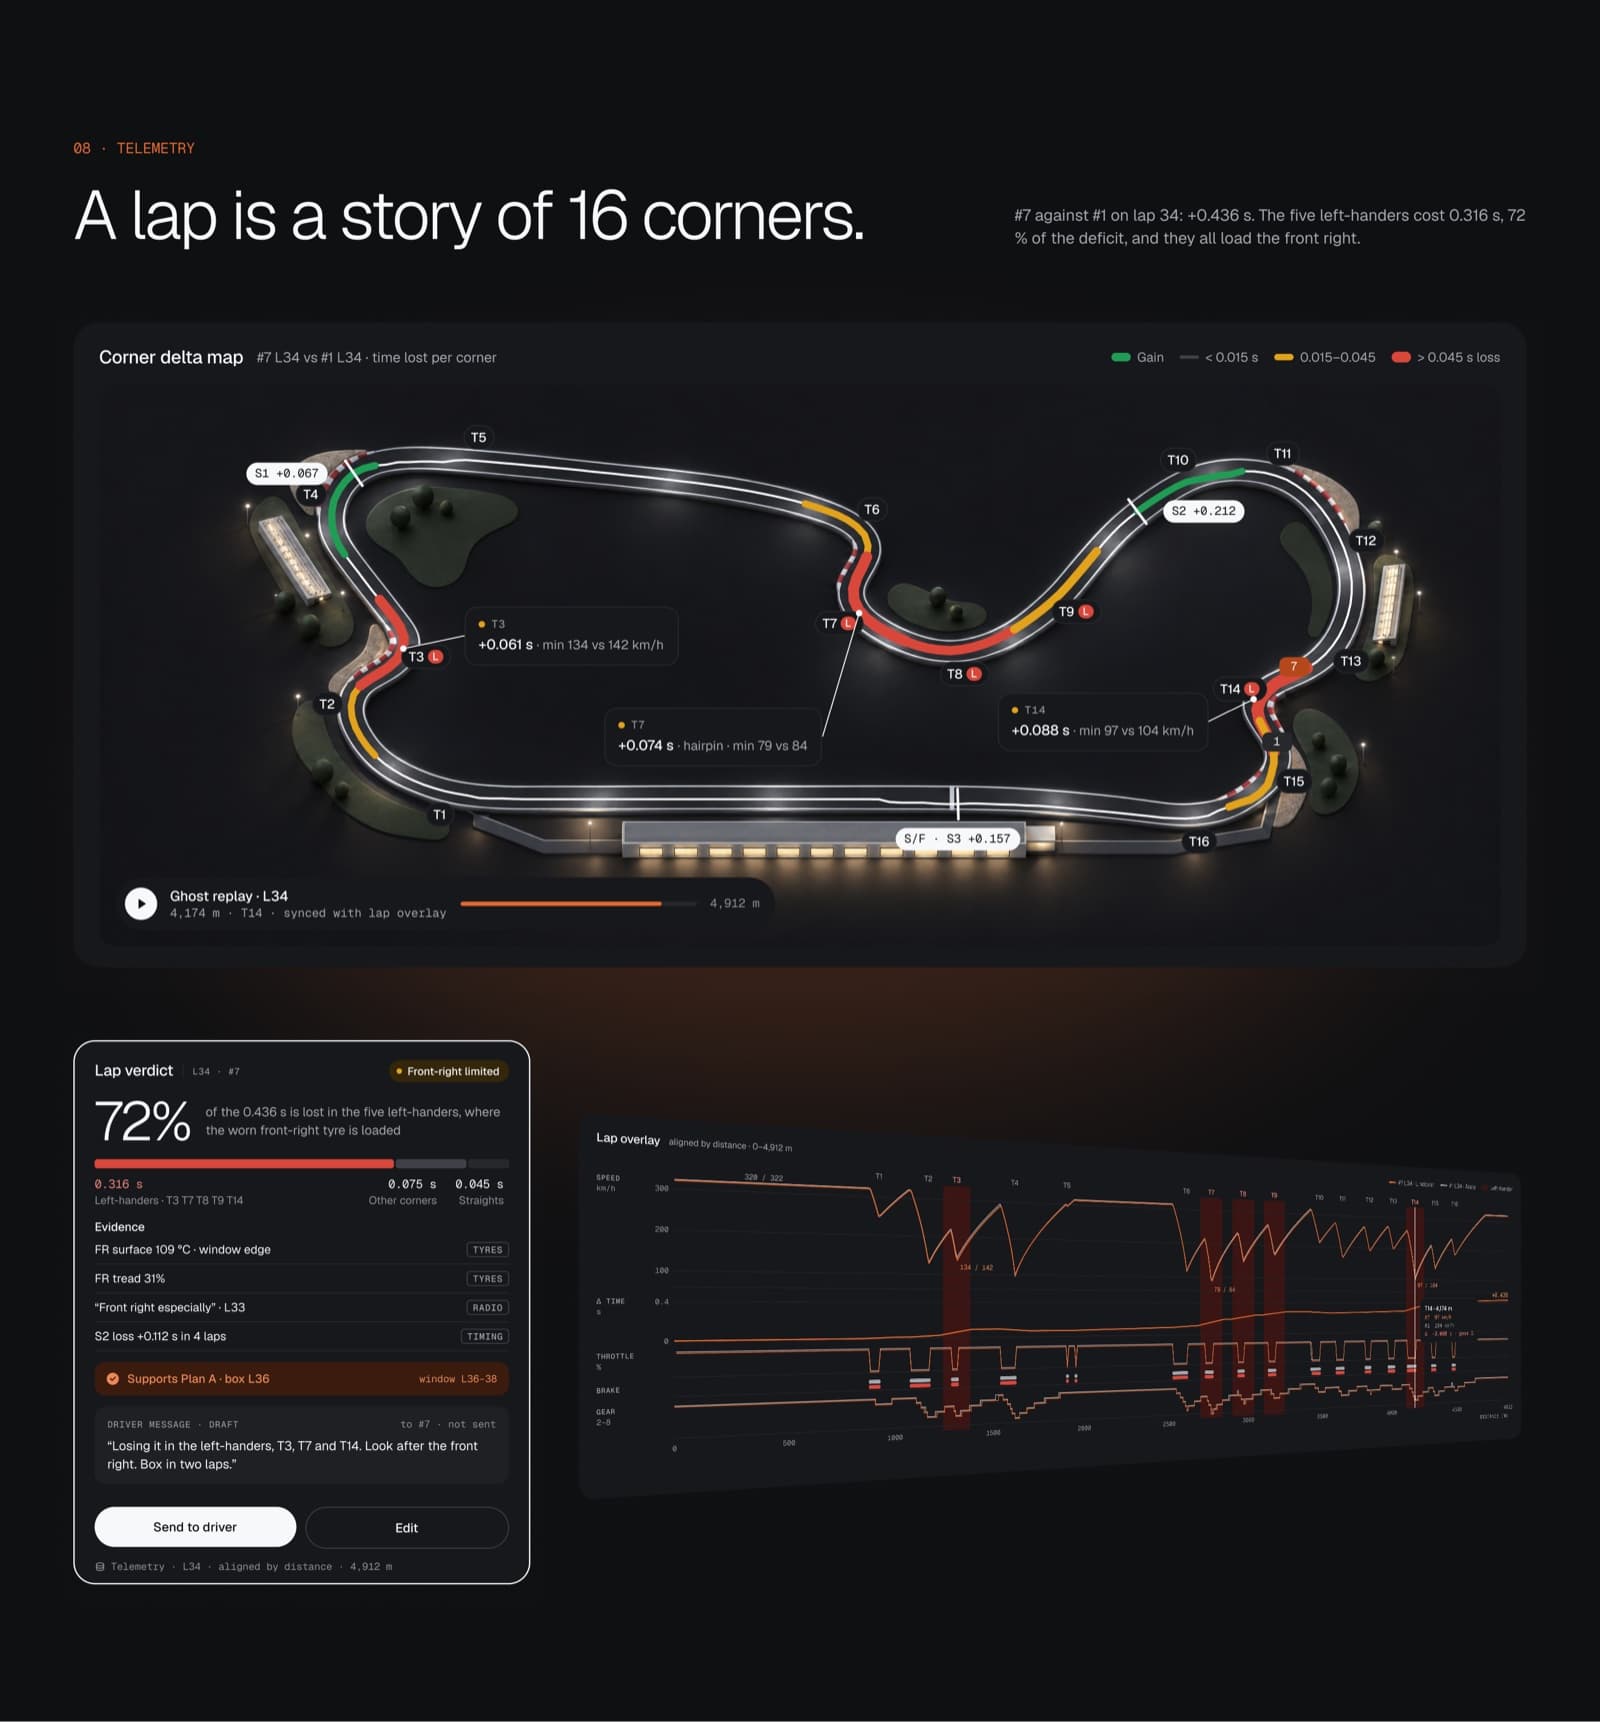 04TelemetryCorner delta map, lap overlay, sector trend.
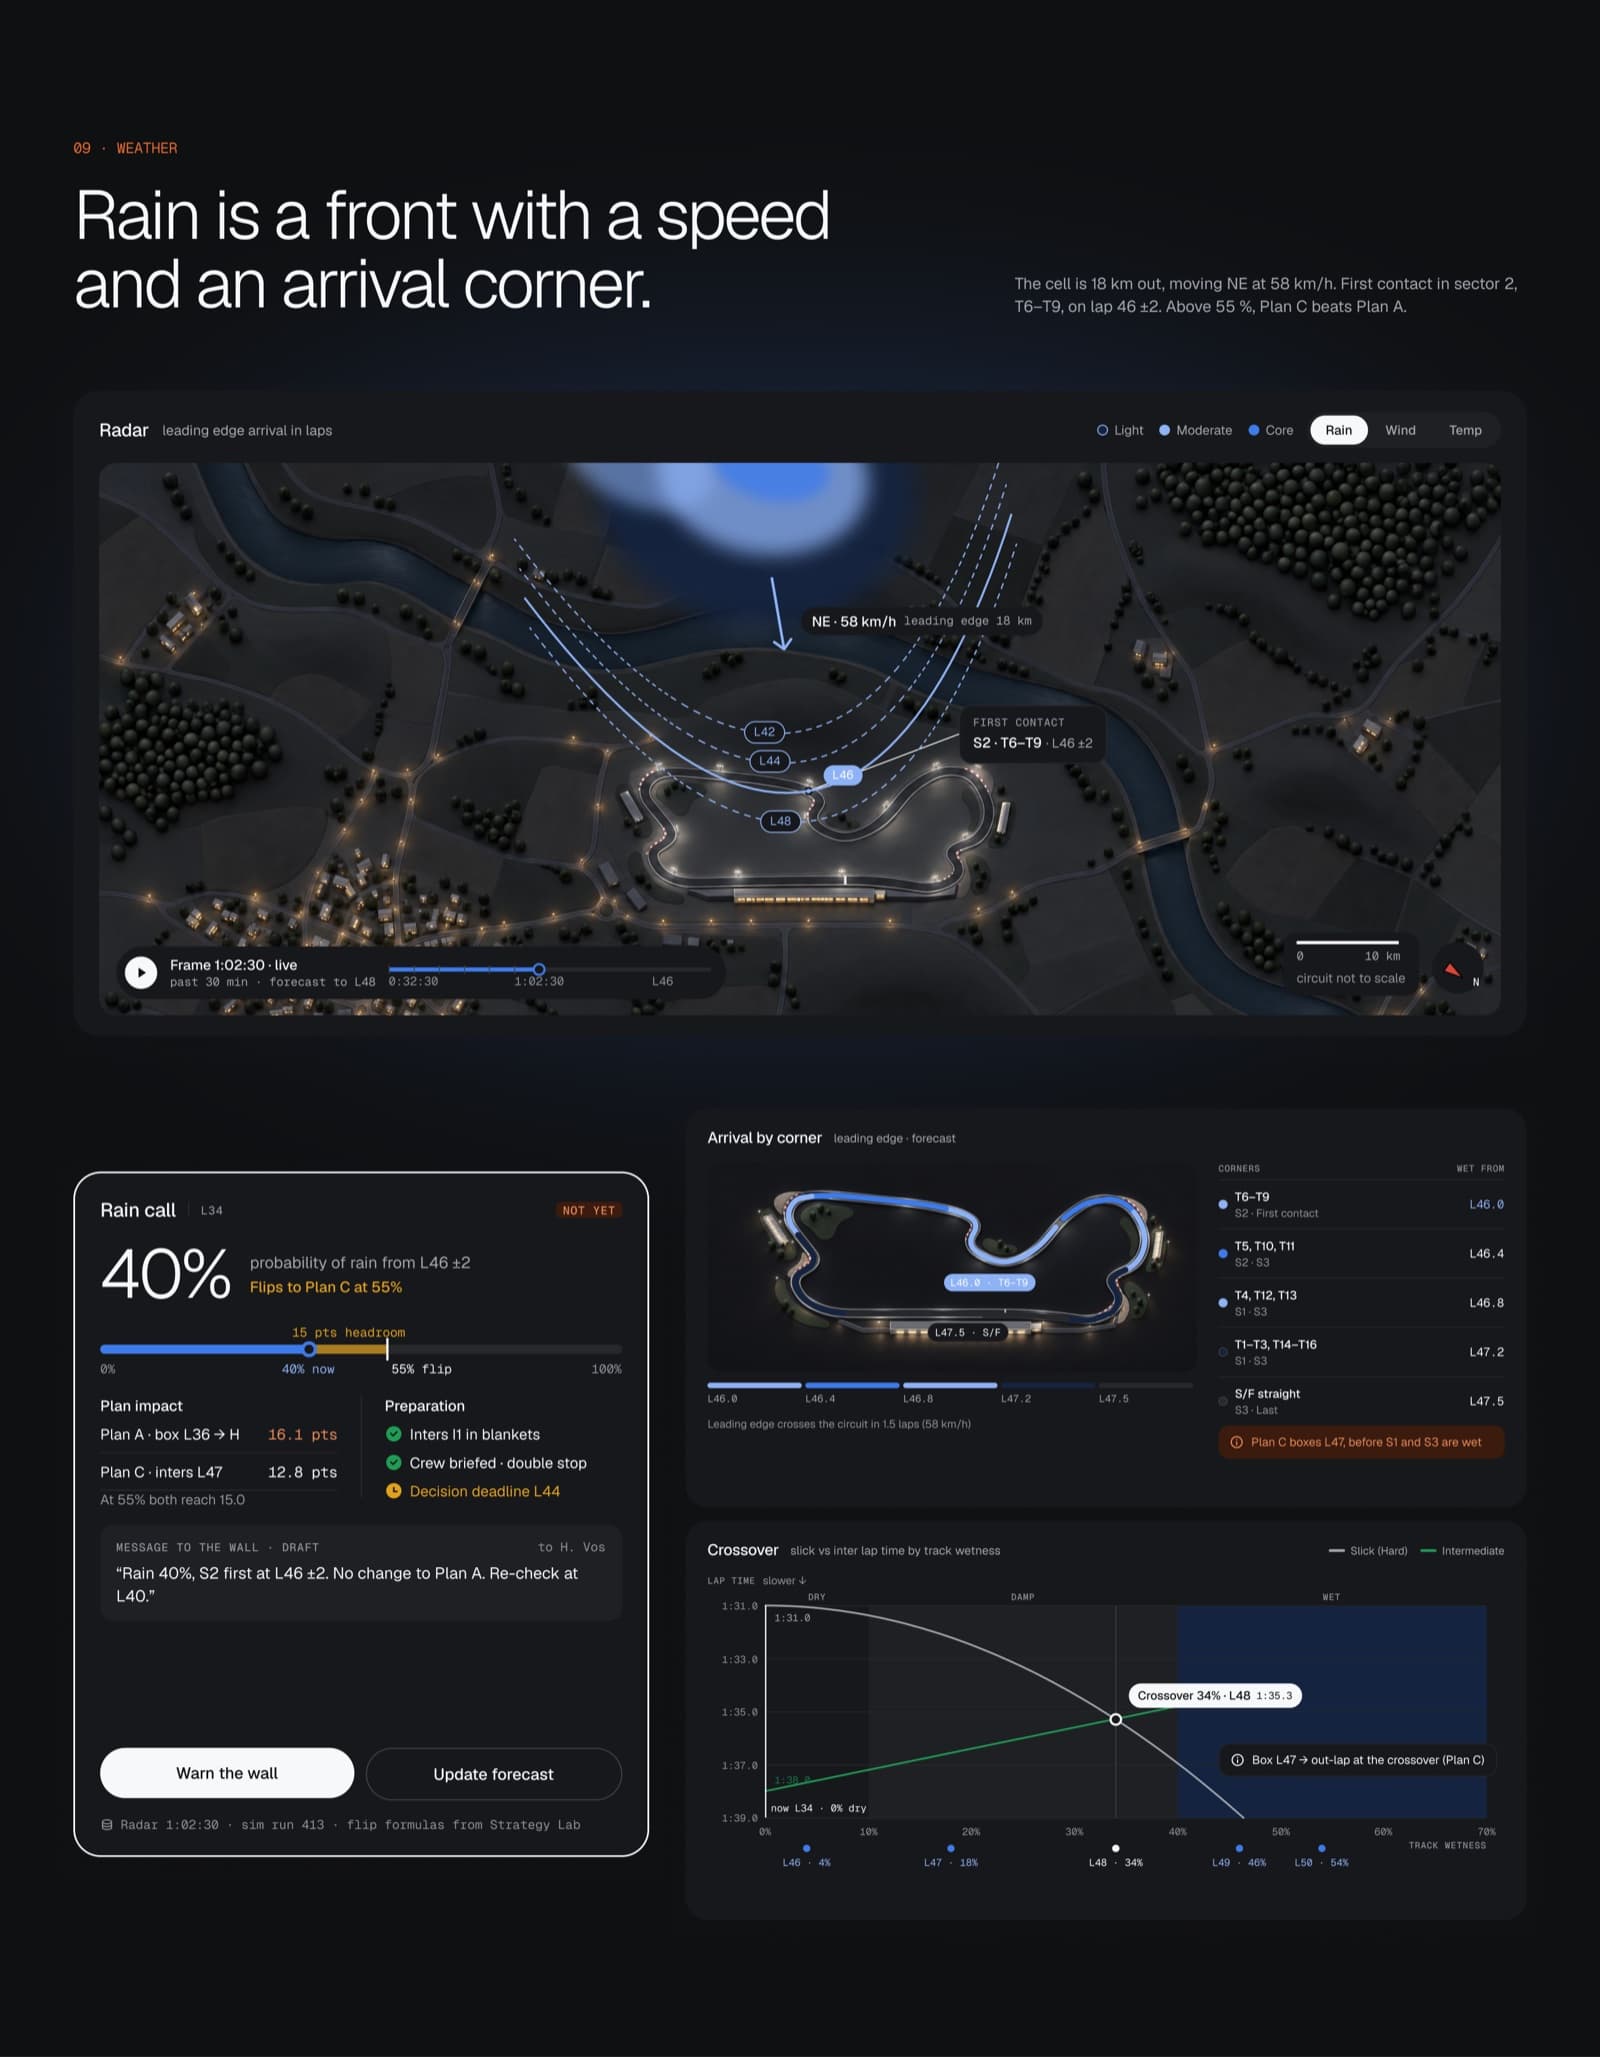 05WeatherRain radar on a regional clay map, slick-to-inter crossover at lap 48.
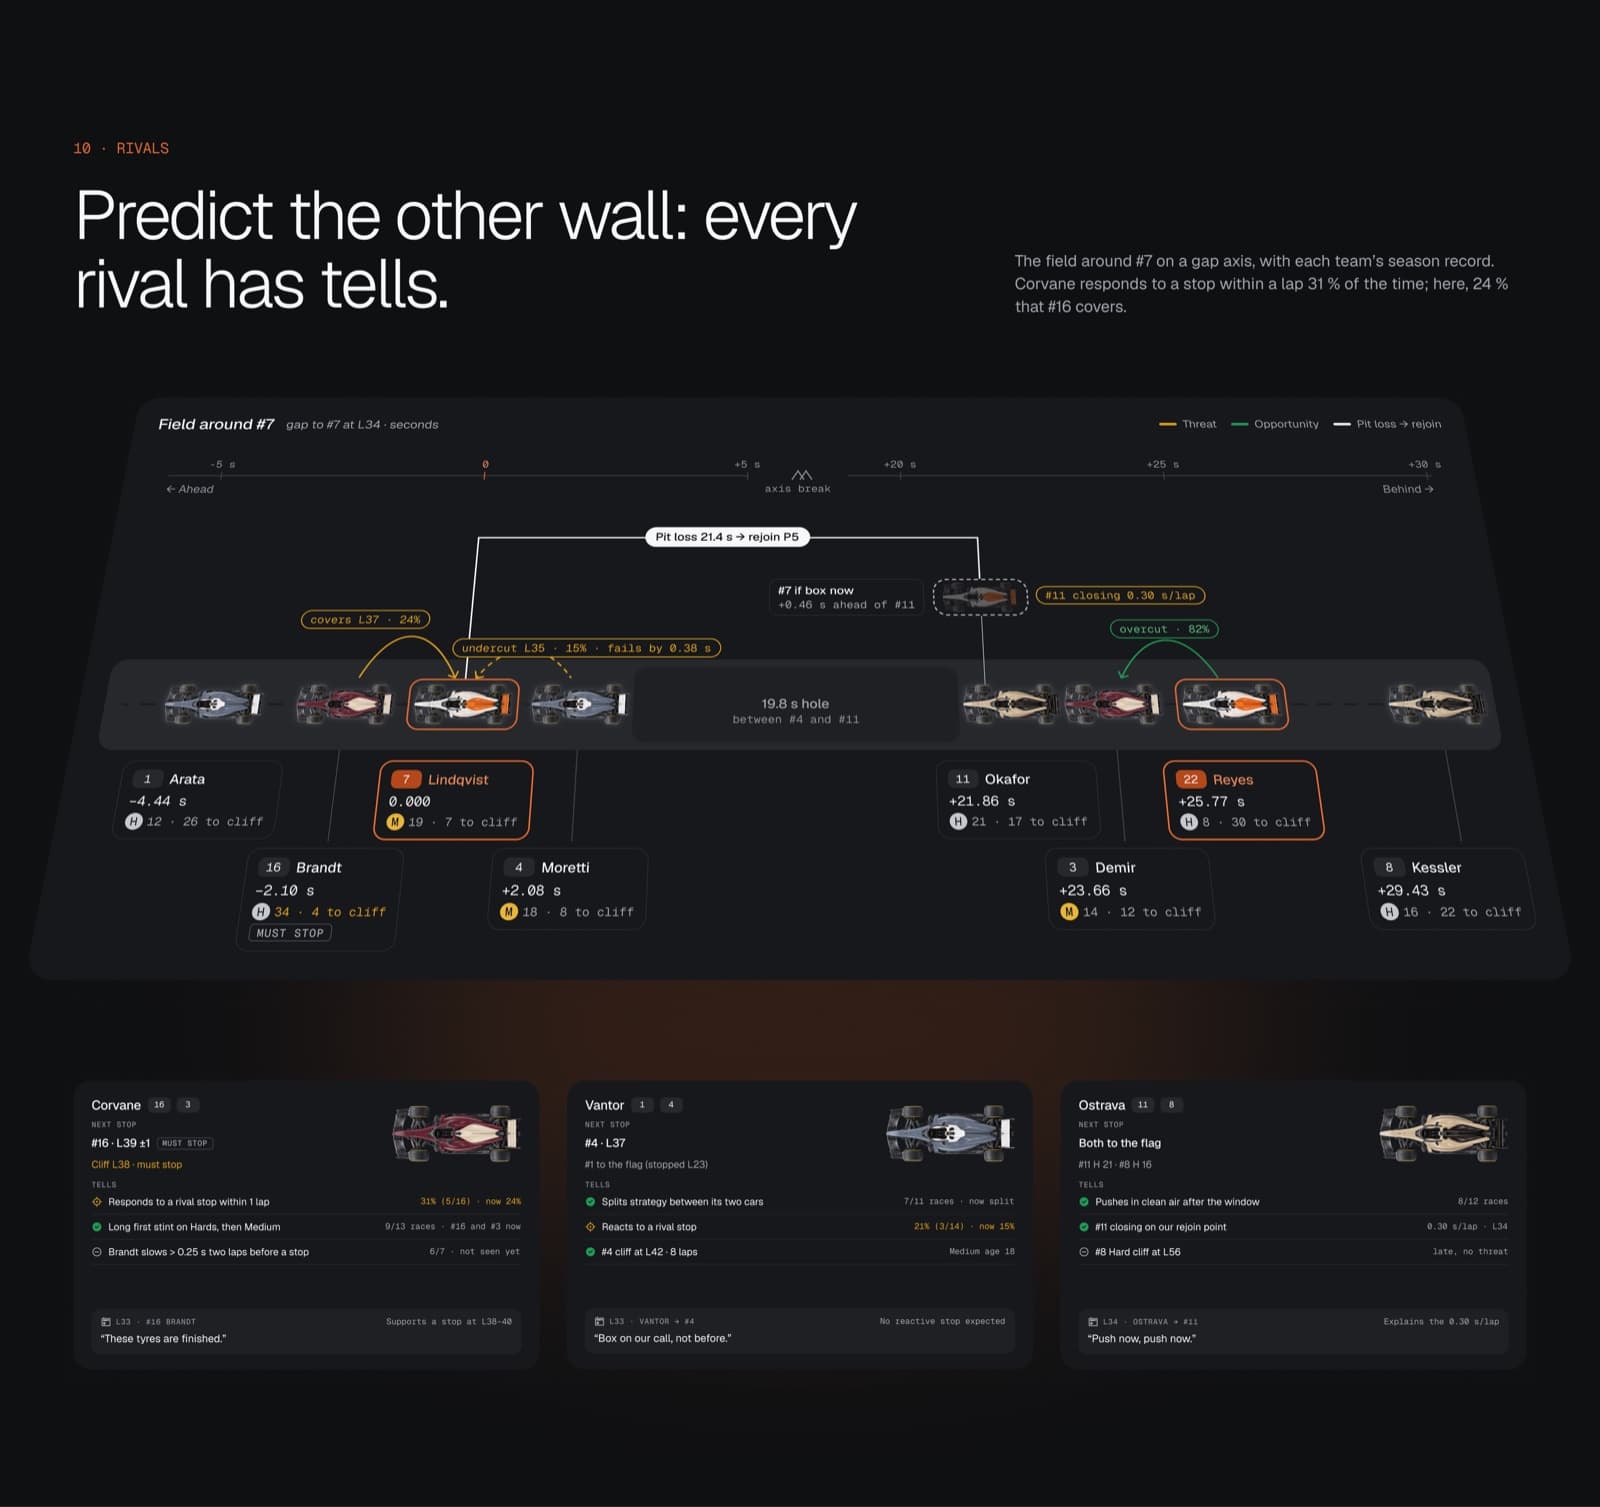 06RivalsThe field around car #7, trigger board, threat ladder.
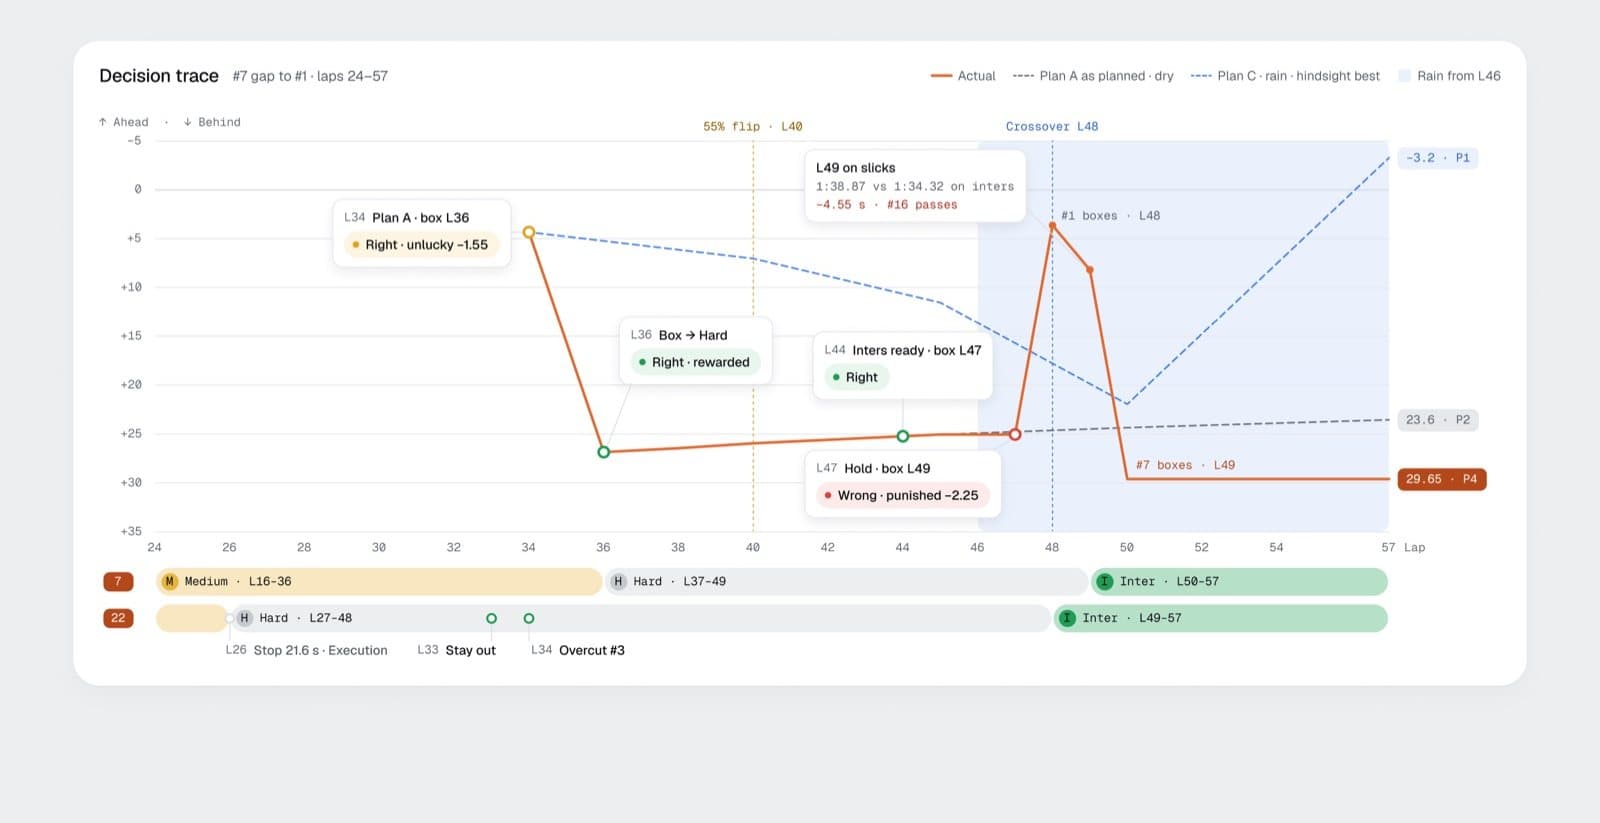 07DebriefLuck vs skill: grade the decisions, not the result.
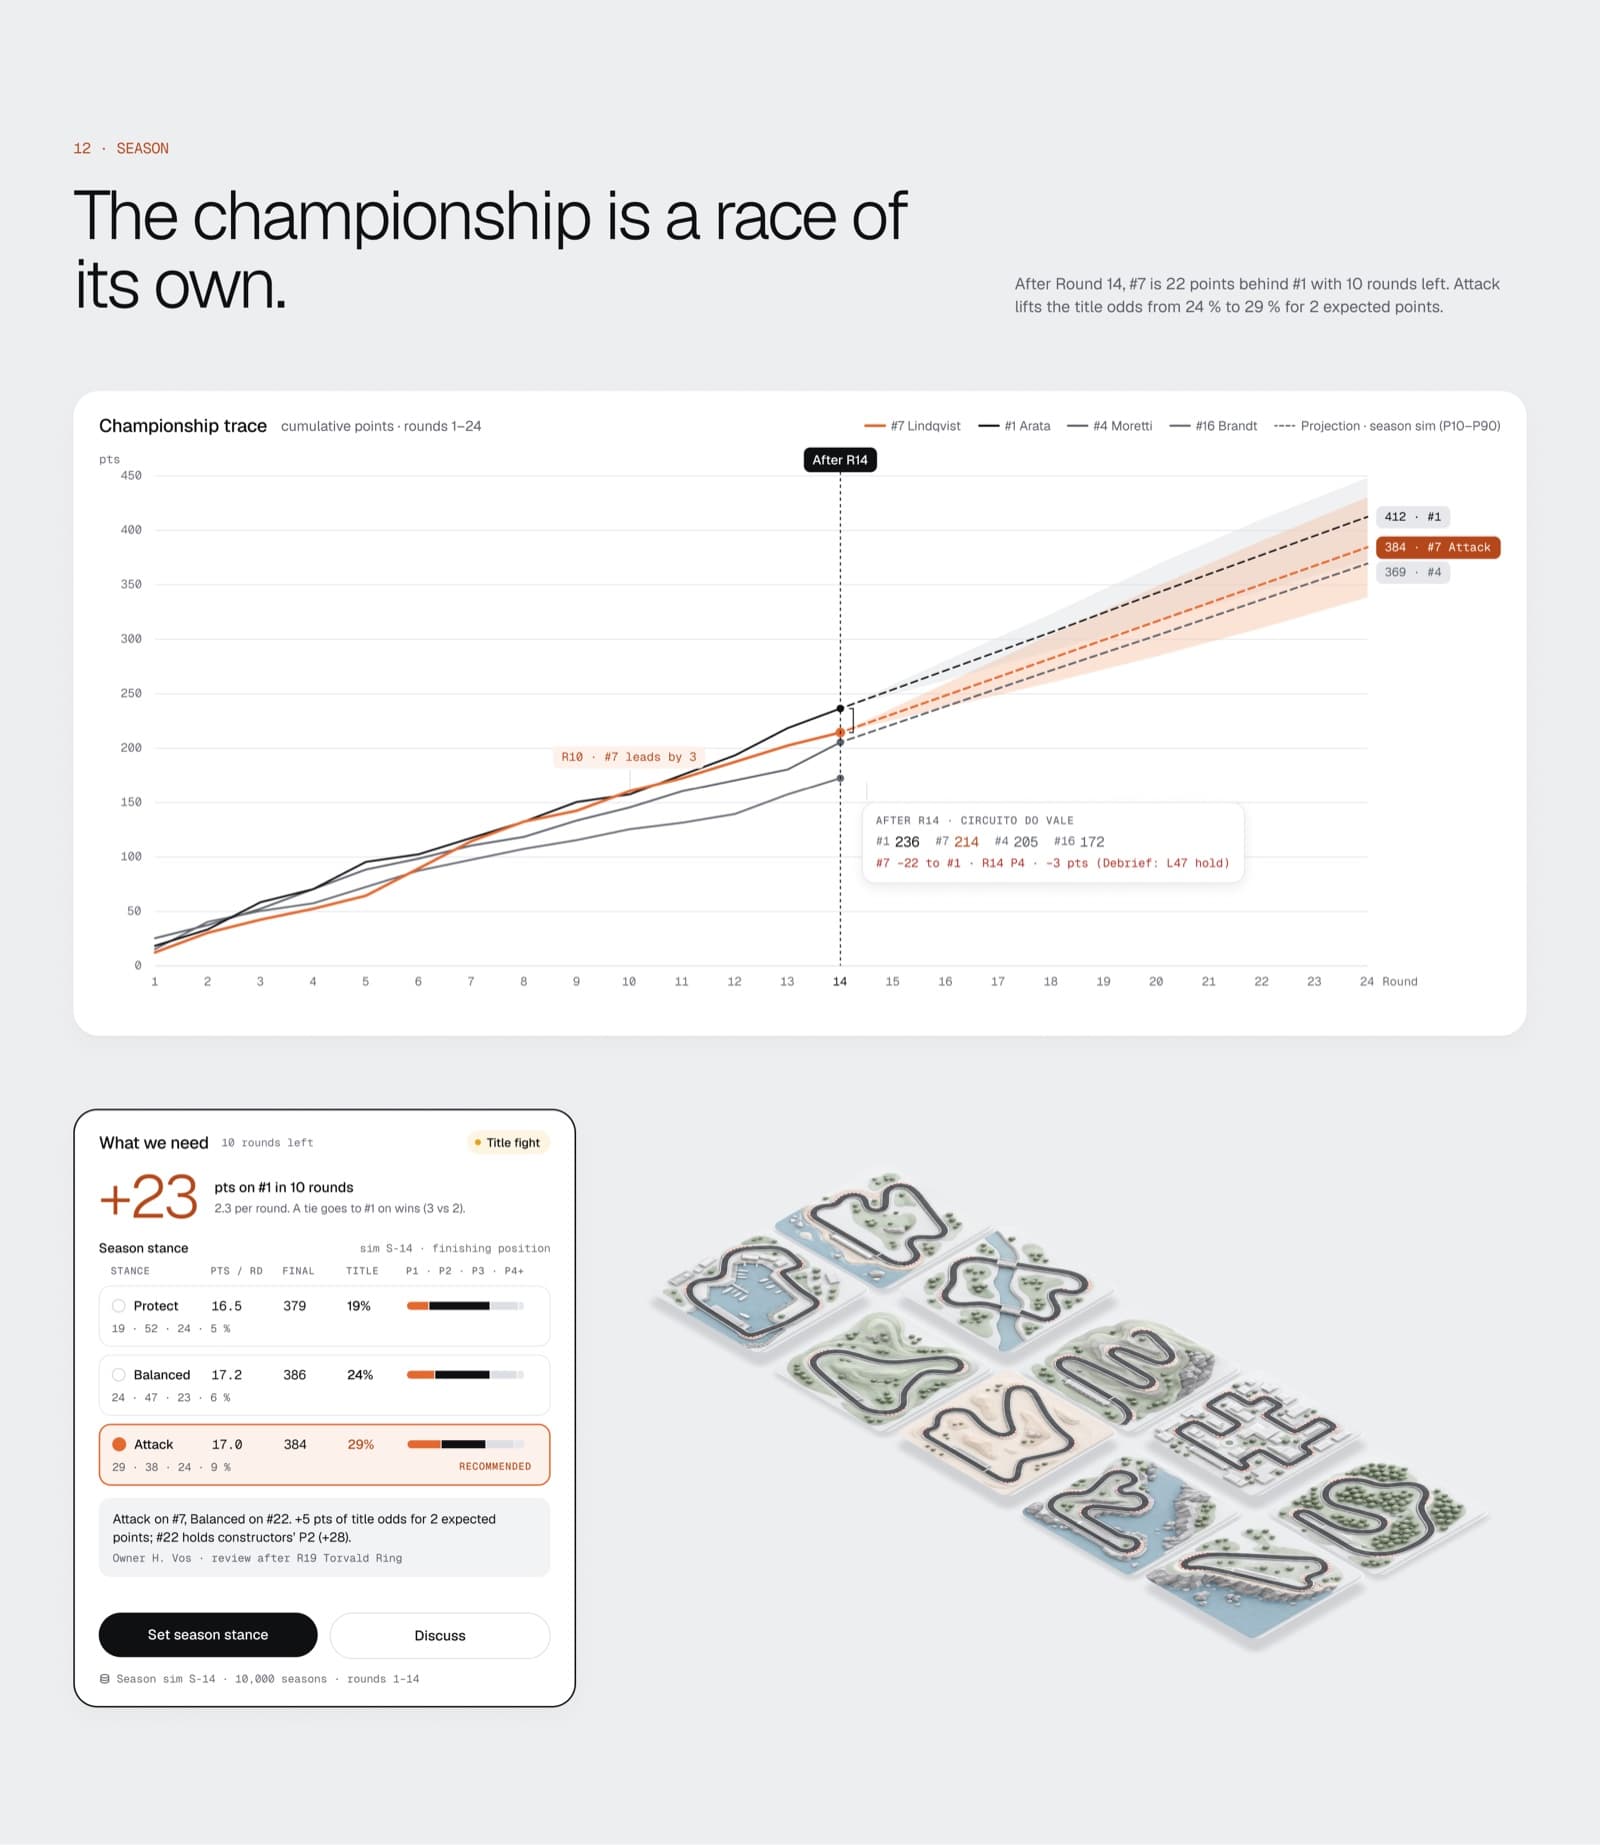 08SeasonChampionship trace, what we need, title odds.
Most dark modes are a repaint. This one is a switch.
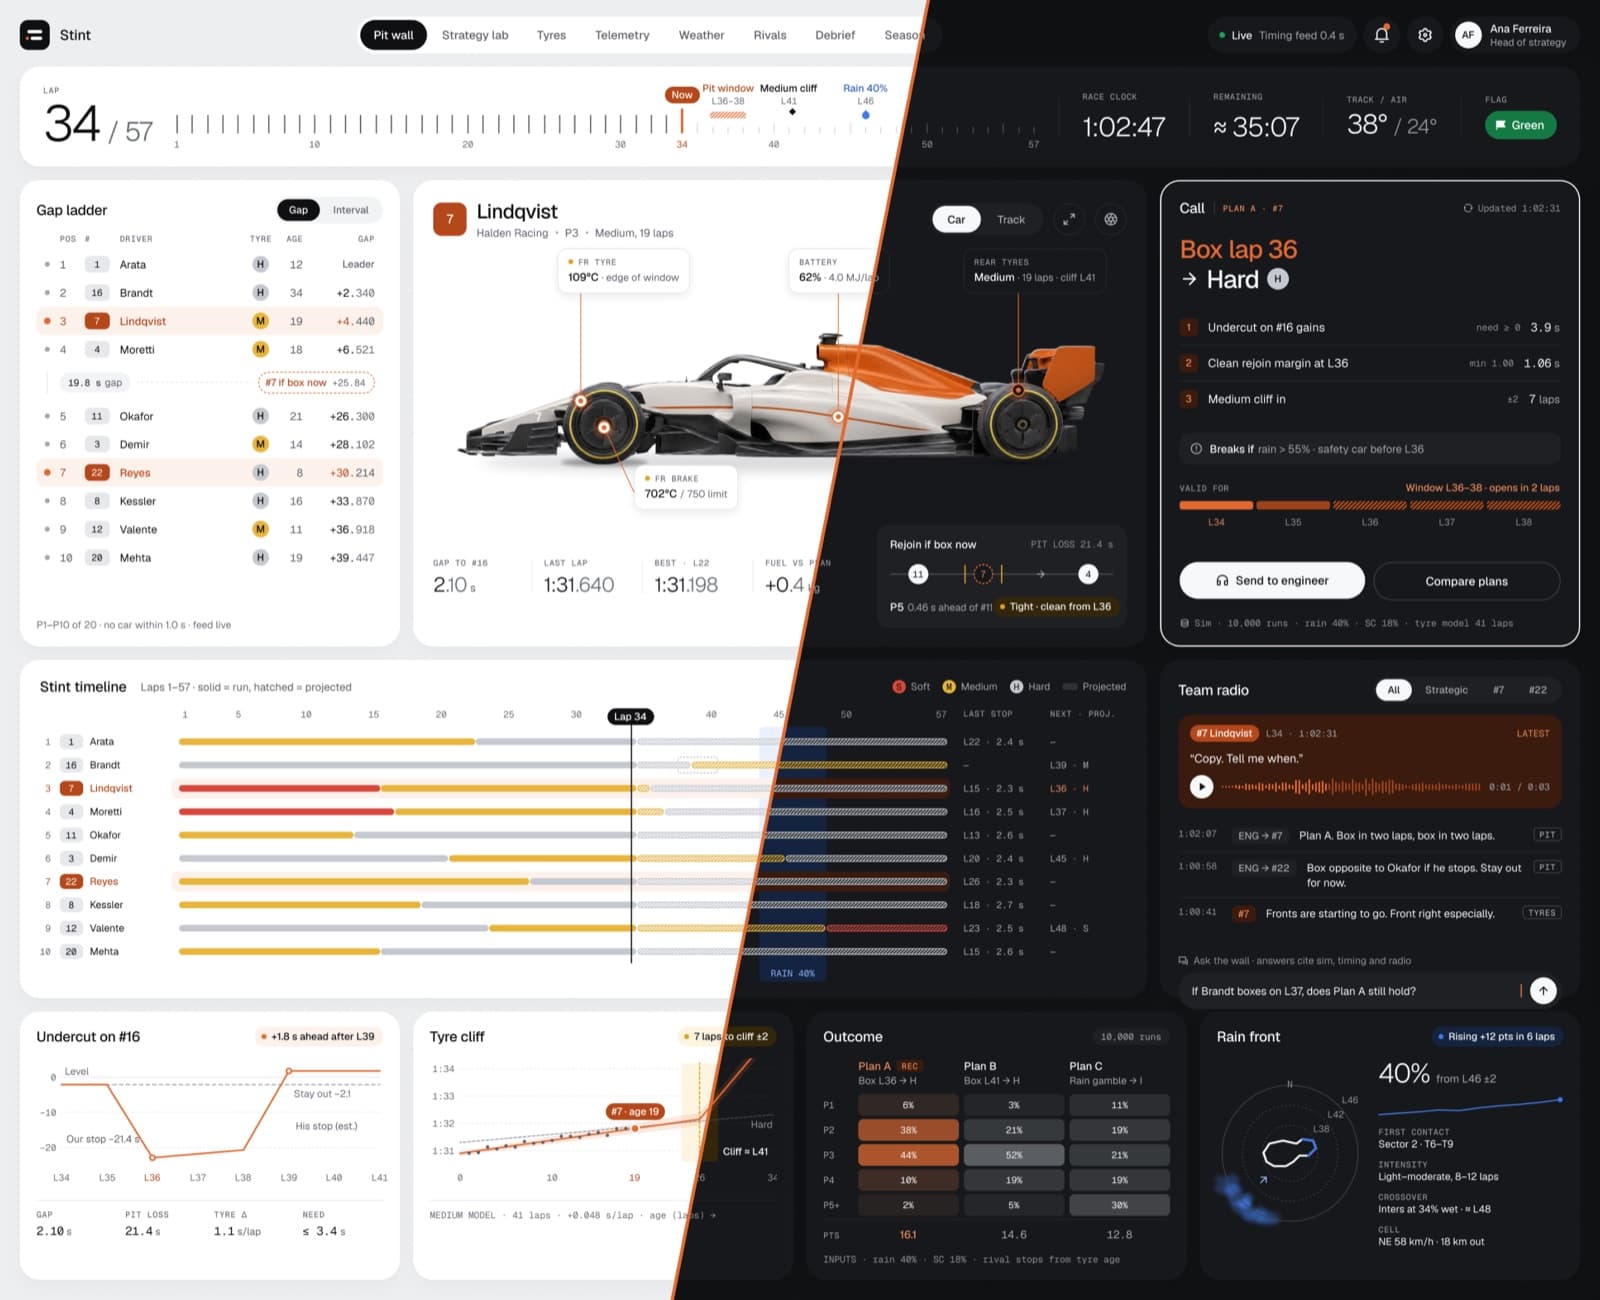
104 variables in one collection, Light and Dark. Flip a frame's mode and the whole page follows. Yes, the images switch too.
What you get
- 8 product pages: each in light and dark (18 frames, 1920 wide)
- Foundations: colour ramps and semantic roles, type scale, number treatment, spacing, radius, elevation, motion tokens
- Components: 12 sets, 49 variants (chips, tags, verdicts, nav, toggles, buttons, hotspot pins, callouts, stats)
- Variables: 104, one “Stint” collection, Light / Dark modes
- Styles: 19 text styles (Geist + Geist Mono), 2 effect styles
- Data visualisation: scenario trees, outcome fans, lap overlay, corner delta map, rain radar, crossover model, championship trace
- Photoreal assets: car, tyres, top-down liveries, clay circuit dioramas, day and night
- Motion: showcase scenes on the Motion page
Ten rules. Here are four.
- 1Start with the decision, not the data. If a block can't say which call it serves, it doesn't ship.
- 2Write the dataset before the first pixel. Plan A is 16.1 expected points on three pages because it's the same table.
- 3One accent, one meaning. Orange is our car. Not hover, not links, not decoration.
- 4Never draw a vector of a real object next to real UI. It looks cheap immediately.
It moves, too.
Good to know
Is it really free?
Yes. Personal and commercial use. Figma Community files ship under CC BY 4.0: credit is appreciated.
Fonts?
Geist and Geist Mono, free on Google Fonts.
Real teams or series?
No. Every team, driver, circuit and championship is fictional.
Do the numbers add up?
Yes. Every number comes from one dataset, so the pages agree with each other.
Can I use it for a non-racing product?
That's the point. The rules work for trading, logistics, ops, analytics: anywhere people decide under pressure.
Saved you a week?
Buy me a coffee. Every supporter's name goes on the Supported by page in the next release.
This is what I do for free. Imagine the paid version.
I design the product, ship it live in Framer, then cut the launch video. 15+ years. If your product deserves this level of craft, let's talk.